
Most plumbing job costing templates are complete garbage. They're either accounting exercises that miss real operational costs, or they're so basic they leave money on the table everywhere. After watching hundreds of plumbing businesses track their actual job costs, the gap between what owners think jobs cost versus reality ranges from 15% to 40%.
The worst part? Nobody catches it until they're staring at bank statements wondering why their "profitable" P&L doesn't match their account balance.
Why standard job costing breaks for residential plumbing
Residential plumbing has bizarre cost structures that generic templates completely miss. Labor costs swing wildly based on time of day. A water heater swap at 2pm costs different labor than the exact same job at 7pm. Travel time between houses eats margin differently than commercial work where you're onsite all day.
Parts overhead isn't just markup—it's handling, storage, truck stock, plus that inevitable trip back to the supply house when you need one more fitting. A plumbing job costing template that actually works needs to capture these messy operational realities. Not the clean version accountants prefer, but the version that matches what happens in your trucks every day.
Building the labor time bands that match reality
Labor costs aren't hourly rates times hours worked. That's fantasy math. Real labor costing for single-visit residential work looks different.
Stop missing service calls and double bookings.
Plummerly helps you schedule, assign, and manage every plumbing job efficiently.
- Centralized job scheduling
- Technician dispatch & tracking
- Customer notifications
No credit card required
-
Standard Hours (7am-5pm M-F) Tech hourly: $28-35/hr Burden rate: 1.42x (includes taxes, comp, benefits) Actual cost: $39.76-49.70/hr Add supervision overhead: 8% True hourly cost: $42.94-53.68
-
After Hours (5pm-9pm M-F) Base tech rate stays same Add shift differential: 15% Burden stays 1.42x True hourly cost: $49.38-61.73
-
Emergency/Weekend Base rate plus 50% premium Burden at 1.42x True hourly cost: $64.41-80.52
Transition time kills margin though. When a tech finishes a 4pm job and starts the next at 5:15pm, you're paying after-hours rates for setup and testing that could've happened during standard hours. Most shops eat this cost without realizing it.
Build your dispatch rules around these bands. Stack complex jobs in standard hours. Push simple stuff to the edges. Operational software can flag when you're about to schedule a high-complexity job into premium time bands, saving hundreds per week just in smarter labor allocation.
Travel allocation that doesn't lie to you
Travel time is where plumbing businesses hemorrhage money while thinking they're fine. Standard approach: Add 30 minutes to every job for travel. Except that's not how residential routes work.
-
Zone A (0-5 miles from shop/last job) Actual drive time: 8-15 minutes Load/unload: 5 minutes Parking/access: 3-8 minutes Total allocation: 20 minutes
-
Zone B (5-12 miles) Drive time: 18-28 minutes Same load/unload: 5 minutes Parking typically harder: 5-10 minutes Total allocation: 35 minutes
-
Zone C (12-20 miles) Drive time: 30-45 minutes Load/unload: 5 minutes Parking varies: 5-10 minutes Total allocation: 50 minutes
Residential techs average 4.2 jobs per day in mixed zones. That's roughly 2.5 hours of travel labor cost that needs to spread across those jobs. At $45/hour true cost, you're looking at $112.50 in daily travel labor to allocate.
-
Zone A jobs
Carry 18% of daily travel cost
-
Zone B jobs
Carry 24% of daily travel cost
-
Zone C jobs
Carry 32% of daily travel cost
-
Callbacks/warranties
Carry full incremental travel
A Zone C job needs to carry $36 in travel labor allocation versus $20.25 for Zone A. Most flat-rate menus ignore this completely.
Parts overhead calculation that captures hidden costs
Parts markup isn't parts overhead. This confusion costs plumbing businesses thousands monthly. Real parts overhead includes direct handling costs, inventory carrying costs, and the inevitable inefficiencies.
Direct handling costs:
-
Ordering time
3 minutes per line item at $35/hour burden = $1.75
-
Receiving/stocking
2 minutes per item = $1.17
-
Truck loading
1 minute per item = $0.58
-
Total handling
$3.50 per line item
Inventory carrying costs:
-
Capital cost on $45k average truck stock at 8% annually = $300/month per truck
-
Shrinkage/damage at 2.5% of parts value
-
Obsolescence at 1.5% annually for specialty items
The real formula: Parts cost × 1.04 (for shrinkage/obsolescence) + $3.50 handling + (monthly carrying cost ÷ average monthly parts used)
For a typical residential plumber doing 85 jobs monthly with $8,500 in parts:
-
Average parts per job
$100
-
Overhead per parts dollar
$0.08
-
Plus flat handling
$3.50
-
Total parts overhead on $100 parts job
$11.50
That's 11.5% overhead before any markup for profit. Shops using straight 50% markup on parts without calculating overhead first are bleeding money everywhere.
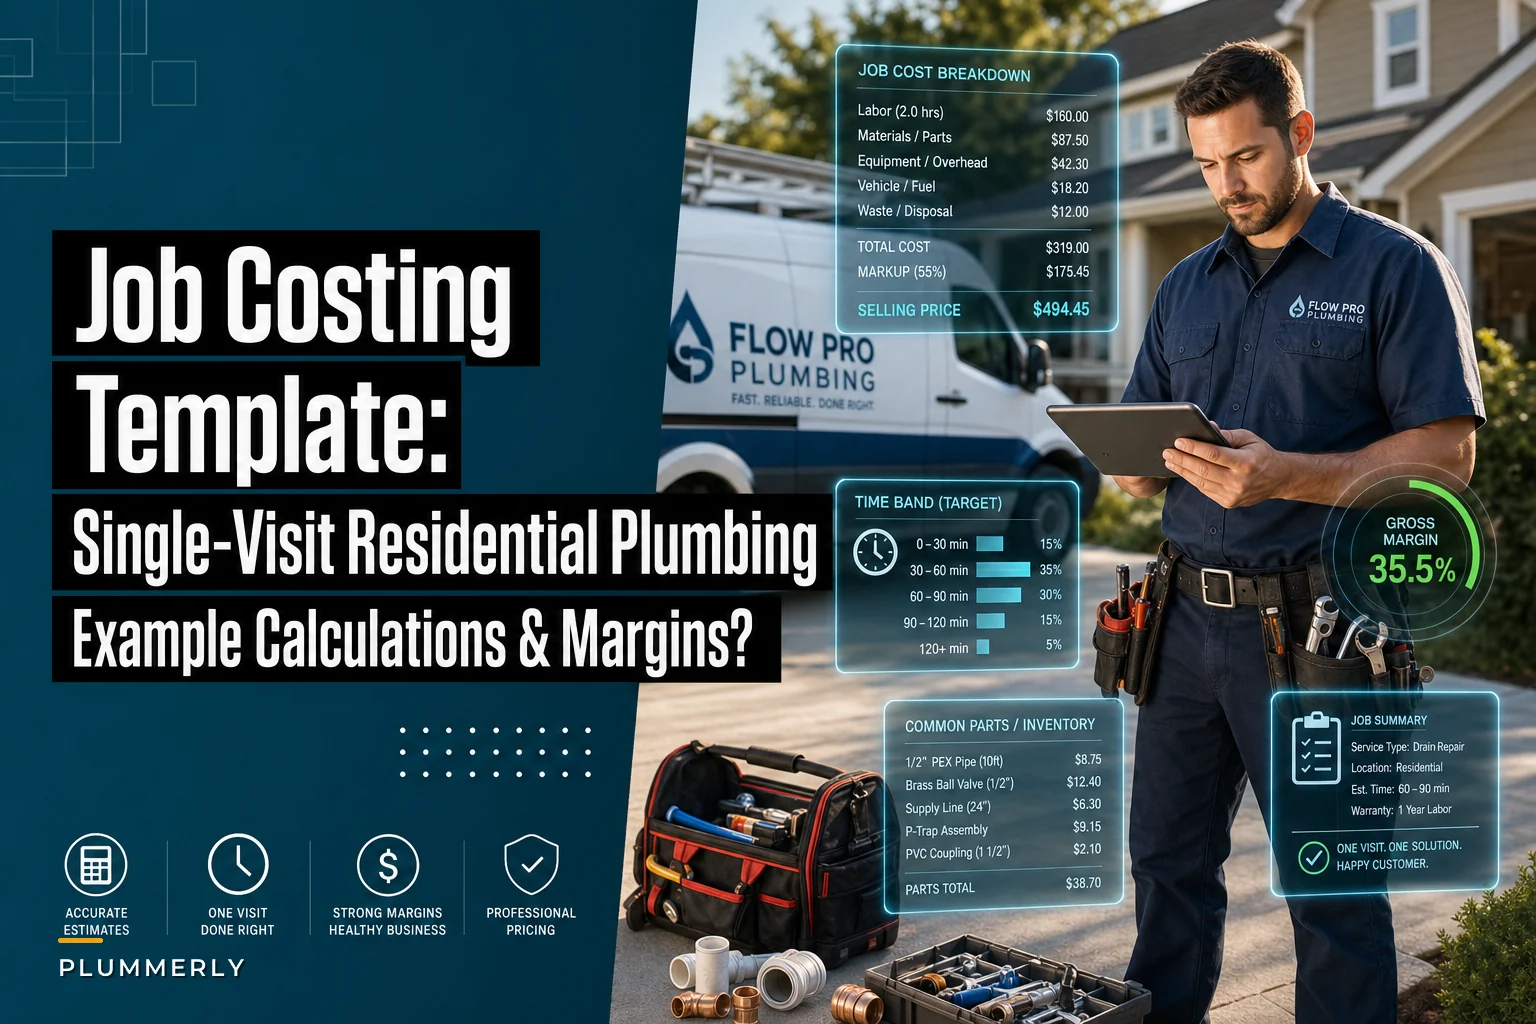
Working through common job calculations
Three standard jobs using this framework:
Kitchen faucet replacement
| Cost Category | Calculation | Amount |
|---|---|---|
| Labor | 1.75 hours × $48/hr | $84.00 |
| Travel | Zone B allocation | $27.00 |
| Parts | $108 + overhead ($12.14) | $120.14 |
| Total Cost | $231.14 | |
| Price (42% margin) | $399 |
Water heater replacement (40 gallon)
Labor breakdown:
-
Drain and disconnect
45 minutes
-
Remove old unit
30 minutes
-
Install new unit
90 minutes
-
Fill and test
30 minutes
Total: 3.25 hours at $48 = $156
| Cost Category | Amount |
|---|---|
| Labor | $156.00 |
| Travel (Zone C) | $36.00 |
| Parts + overhead | $516.50 |
| Disposal | $25.00 |
| Total Cost | $733.50 |
| Price (45% margin) | $1,349 |
Toilet repair (flapper and fill valve)
Simple jobs still need proper costing. Total time: 45 minutes at $48 = $36, plus Zone A travel ($20.25) and parts overhead ($5.26). Total cost: $61.51. Price at $139 for 55% margin.
Margin rules based on job complexity
Not all jobs deserve the same margin. Framework that balances profitability with market reality:
-
Quick repairs (under 1 hour)
55-65% margin. Lower absolute dollars need higher percentage to cover overhead. Market accepts because convenience value is high.
-
Standard repairs (1-3 hours)
42-48% margin. Sweet spot for most residential work. Balances profit with competitive pricing.
-
Equipment replacement
38-45% margin. Lower percentage but higher dollars. Material costs dominate the invoice.
-
Emergency/after-hours
Add 25-35% to standard margin. Covers premium labor costs. Customers expect premium pricing.
Diagnostic minimum: Fixed fee of $125-175. Must cover 45 minutes total time including travel. Non-negotiable even if "just looking."
Common costing mistakes that destroy margins
The "helper doesn't count" mistake: Every shop does this. They send a helper but only cost the lead tech's time. That helper at $18/hour with burden costs you $27/hour. On a 3-hour job, that's $81 in uncaptured labor cost.
The "parts run doesn't count" mistake: Tech spends 45 minutes getting parts. Shop only counts the "repair time." That parts run at $48/hour just added $36 to your real job cost.
The "callback is just goodwill" mistake: Free callback for legitimate issues makes sense. But not costing it means you don't know your real first-time fix rate impact. A single callback typically costs $95-120 in labor and travel. If you're running 8% callback rate, that's roughly $9 per job in hidden cost.
The "shop time is overhead" mistake: When techs spend 20 minutes each morning loading trucks and 15 minutes each evening doing paperwork, that's 35 minutes of direct job cost that should be allocated. For 4.2 jobs daily, that's 8.3 minutes or roughly $7 per job.
Building your own costing worksheet
Start with this template structure. Section 1: Labor bands with 4-5 time bands, true burdened cost for each, including supervision overhead. Section 2: Travel zones mapped to your actual service area, timing typical routes in each zone, building allocation percentages. Section 3: Parts overhead with monthly carrying costs calculated, actual handling time tracked, shrinkage reality included. Section 4: Job templates for 15-20 common jobs, calculated using all factors above, appropriate margins set by category. Section 5: Validation tracking to compare estimated versus actual weekly, identify which factors are off, adjust template quarterly.
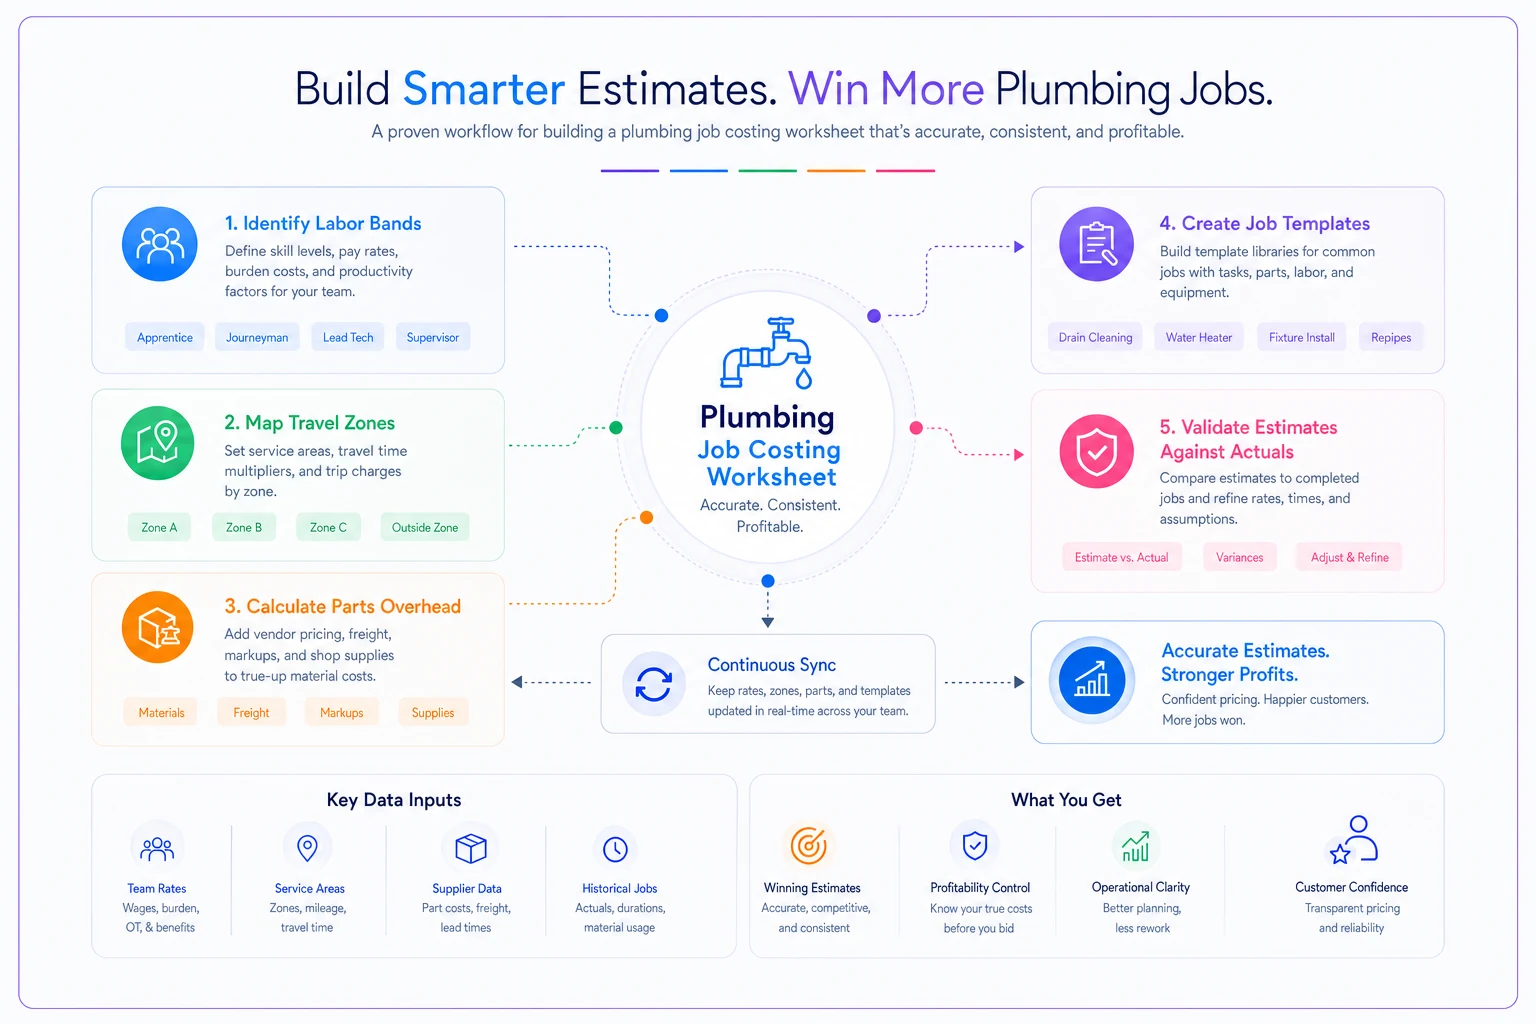
The spreadsheet mechanics matter less than capturing all the real costs. Whether you use Excel, Google Sheets, or job management software, the framework stays the same.
When to update your costing model
Your plumbing job costing template isn't set-and-forget. Market conditions and operational changes require updates.
Quarterly reviews should cover labor cost changes, parts price shifts, and travel pattern changes. Trigger-based updates happen when fuel costs swing 15%+, you add new service zones, team structure changes, or callback rate shifts significantly.
Annual overhauls include complete time studies, margin target reviews, and validation against actual P&L.
Technology and better job costing
Modern operational software transforms job costing from spreadsheet guesswork to real-time accuracy. When your system tracks actual time per task, real travel distances, and true parts costs automatically, you get costing that matches reality instead of estimates.
The powerful part isn't just accurate costing—it's pattern recognition. AI-powered platforms can identify which jobs consistently run over, which techs have higher callback rates, and which zones actually cost more to service than your manual calculations suggest. Your pricing evolves based on operational reality, not theoretical models.
Some platforms now integrate time tracking, parts management, and route optimization to give you actual job cost within minutes of completion. No more waiting until month-end to discover you've been losing money on certain job types.
Making it actually work in daily operations
The best plumbing job costing template means nothing if nobody uses it. Keep the field process simple. Techs don't need to know the full costing model. They need to track: start time, travel time, task time, parts used, and completion. Everything else calculates behind the scenes.
Keep the tech-facing checklist to: start time, travel time, task time, parts used, and completion.
Review job costs weekly, not monthly. Monday morning, pull the previous week's jobs. Compare estimated to actual. Find the gaps. Fix them before they become patterns.
Share margin data with service managers, not just owners. When managers understand real job profitability, they make better dispatch decisions. They stop sending two techs when one would work. They batch Zone C jobs instead of mixing zones randomly.
Price adjustments should happen monthly for small changes, quarterly for major updates. Markets shift too fast for annual price reviews. But daily changes confuse customers and staff.
Build in margin protection for uncertainty. If your costing shows you need $399 to hit target margin, price at $419. That buffer covers the small misses that always happen—the parking that took longer, the rusty fitting that fought back, the customer questions that extended the visit.
Real job costing for plumbing businesses isn't about perfection. It's about capturing enough cost reality to price profitably while staying competitive.
The template structure here—labor bands, zone-based travel, true parts overhead, and margin rules by job type—gives you that foundation. But the numbers only work when they match your actual operation. A San Diego plumber has different costs than someone in Cincinnati. Urban routes cost different than suburban. Your specific reality matters more than any template.
Start by costing 10 common jobs using this framework. Track them for a month. See where estimates miss reality. Adjust and track again. Within 90 days, you'll have job costing that actually reflects your business, not some theoretical plumbing operation.
The shops that get this right consistently run 15-20% better margins than those guessing at costs. On $800k in annual revenue, that's $120k to $160k in additional profit. Worth getting right.
Ready to optimize your plumbing operations?
Join 500+ plumbing businesses using Plummerly to save time, reduce scheduling errors, and improve customer satisfaction.