

Every plumbing business owner I know tracks revenue. Most track job counts. A few track callback rates. But what really kills growth is running a shop where your office manager watches dispatch times, your lead tech tracks completion rates, and you're staring at monthly P&Ls wondering why profits keep shrinking despite growing revenue.
This disconnect happens because plumbing businesses naturally develop three operational layers. Your executive view needs different data than your dispatcher's hourly scramble, and your field techs need metrics that actually help them improve—not just scorecards that make them feel monitored. When these layers run on different metrics (or worse, the same metrics interpreted differently), decisions never align with actual profitability.
A mid-size operation in Phoenix nearly went under because of exactly this. The owner tracked revenue per truck obsessively. His ops manager measured jobs per day. Field supervisors counted callbacks. Three layers, three different scorecards, zero coordination. Trucks raced through profitable water heater replacements to hit daily job quotas. Callbacks jumped. Margins collapsed. The owner couldn't figure out why hitting their "targets" actually meant losing money.
Why Standard KPI Frameworks Break in Plumbing Operations
Plumbing has this weird characteristic where your highest-margin work often takes the longest, but your cash flow depends on volume. A repiping job might net you $3,800 in profit over two days, while emergency calls generate $400 profit in 90 minutes. Traditional KPI frameworks treat these equally or, worse, push teams toward whatever's being measured that week.
Most plumbing KPIs fail because they're borrowed from other industries. You'll see shops tracking "utilization rates" like they're running a factory, or "customer satisfaction scores" without connecting them to actual operational decisions. A 4.7-star Google rating means nothing if those happy customers are all one-time $200 drain clearings while your $8,000 repipe customers never leave reviews.
Plumbing work varies wildly in complexity, margin, and resource requirements. Your executive metrics need to capture strategic health—are we growing profitably? Your operations metrics need tactical clarity—are we deploying resources effectively? Your technician metrics need immediate actionability—am I performing well today?
When I restructured metrics for a shop doing around $3.2M annually, we discovered their "most productive" technician (by jobs completed) was actually their least profitable. He cherry-picked quick fixes, avoided complex diagnostics, and generated the highest callback rate. But he looked fantastic on their single-layer dashboard showing jobs per day.
Building Your Three-Tier Plumbing KPI Framework
Each tier has specific metrics, data sources, and—critically—decision triggers that turn numbers into actions.
Stop missing service calls and double bookings.
Plummerly helps you schedule, assign, and manage every plumbing job efficiently.
- Centralized job scheduling
- Technician dispatch & tracking
- Customer notifications
No credit card required
The three tiers break down into executive, operations, and technician views, each requiring different KPIs and reporting cadences.
Executive Layer KPIs (Owner/GM View)
Gross Margin by Service Line
-
Definition
(Revenue - Direct Costs) / Revenue for each service type
-
Data Source
Job tickets tagged by type + materials/labor from timesheets
-
Reporting
Weekly trends, monthly analysis
-
Decision Rule
Below 52-58% for 2 weeks → Review pricing or eliminate service
-
Decision Rule
Above 68-72% consistently → Expand marketing for this service
Revenue per Available Tech Hour
-
Definition
Total revenue / (Tech hours scheduled - PTO/sick time)
-
Data Source
Scheduling system + payroll records
-
Reporting
Daily tracking, weekly review
-
Decision Rule
Below $175-190/hour for 5 days → Add tech or reduce coverage area
-
Decision Rule
Above $235-250/hour sustained → Hire immediately or raise prices
Customer Lifetime Value to Acquisition Cost
-
Definition
(Average ticket × Purchase frequency × Retention period) / Marketing cost per customer
-
Data Source
CRM history + marketing spend by channel
-
Reporting
Monthly by acquisition source
-
Decision Rule
Below 3.2:1 ratio → Cut that marketing channel
-
Decision Rule
Above 7.5:1 ratio → Double investment in that channel
Cash Conversion Cycle
-
Definition
Days from job completion to payment received
-
Data Source
Accounting system job close dates vs payment dates
-
Reporting
Weekly aging report
-
Decision Rule
Over 17-19 days average → Implement job-site payment policy
-
Decision Rule
Over 28 days → Stop serving commercial accounts causing delays
Cash Conversion Cycle
Operations Layer KPIs (Dispatcher/Operations Manager View)
Schedule Efficiency Rate
-
Definition
Billable hours / Total scheduled hours
-
Data Source
Dispatch board vs actual time entries
-
Reporting
Real-time dashboard, daily summary
-
Decision Rule
Below 72-78% by noon → Start calling ahead to fill gaps
-
Decision Rule
Below 63-67% for the day → Adjust next day's routing
First-Call Resolution Rate
-
Definition
Jobs completed without return visit / Total jobs
-
Data Source
Job tickets with "callback" tags
-
Reporting
Daily by technician, weekly trends
-
Decision Rule
Tech below 82-87% → Pair with senior tech next day
-
Decision Rule
Company below 79-83% → Morning training on diagnosis
Parts Run Frequency
-
Definition
Supply house trips per 10 completed jobs
-
Data Source
GPS tracking + completed job count
-
Reporting
Daily by truck
-
Decision Rule
Over 2.8-3.2 trips per 10 jobs → Review truck stock levels
-
Decision Rule
Over 4.5 trips → Mandatory restock protocol that afternoon
Average Response Time by Priority
-
Definition
Call received to arrival, segmented by priority tier
-
Data Source
Phone system timestamps + GPS arrival data
-
Reporting
Live dashboard with 4-hour rolling average
-
Decision Rule
Emergency >85-95 minutes → Pull tech from maintenance
-
Decision Rule
Any category >20% over target → Re-route immediately
Average Response Time by Priority
Technician Layer KPIs (Field Tech View)
Diagnostic Accuracy Score
-
Definition
Initial diagnosis confirmed by completion / Total diagnoses
-
Data Source
Job notes comparing initial assessment to final work
-
Reporting
Weekly individual scorecard
-
Decision Rule
Below 78-83% → Shadow senior tech for 2 days
-
Decision Rule
Above 92-96% → Eligible for lead tech role
Revenue per Visit
-
Definition
Total invoice amount / Number of visits to complete
-
Data Source
Individual job tickets
-
Reporting
Daily via mobile app, weekly rankings
-
Decision Rule
Bottom 25% for week → Review upsell training
-
Decision Rule
Top performer 3 weeks → Share approach at team meeting
Material Waste Percentage
-
Definition
Unused materials returned / Total materials pulled
-
Data Source
Truck inventory logs
-
Reporting
Weekly by technician
-
Decision Rule
Over 13-17% → Review estimation skills
-
Decision Rule
Over 22-26% → Require photo before pulling parts
Customer Communication Score
-
Definition
Completion of required updates (arrival, diagnosis, completion)
-
Data Source
CRM activity logs
-
Reporting
Real-time on mobile, daily summary
-
Decision Rule
Below 88-92% → Next-day reminder training
-
Decision Rule
Below 73-77% → Cannot take high-value jobs
Customer Communication Score
Data Sources That Actually Work (Not What Consultants Sell You)
The biggest mistake shops make is buying fancy reporting tools before fixing their data inputs. Your service software probably claims to track everything, but garbage data means garbage metrics.
Job Tickets must include service type tags (not just "plumbing repair"), actual start/stop times (not just scheduled slots), materials used with quantities (not just "parts"), and specific problem/solution codes (not free text). Without this standardization, you're tracking nothing useful.
Time Tracking through GPS breadcrumbs from trucks tells you more than timesheets. Match arrival times to customer sites automatically. Track supply house visits without relying on self-reporting. Your techs aren't lying, but they're human—automated tracking removes the guesswork.
Customer Data - Stop treating your CRM like a phone book. Track acquisition source, service history, communication preferences, and property details. A customer with three properties needs different metrics than a one-time emergency call.
Financial Integration - Your metrics mean nothing if they're not tied to actual costs. Labor costs need real hourly rates including burden. Materials need actual purchase prices, not list prices.
Dashboard Mock-Ups That Drive Real Decisions
Executive Dashboard (Daily View)
┌─────────────────────────────────────────────────┐ │ PROFIT HEALTH Date: Today │ ├─────────────────────────────────────────────────┤ │ Gross Margin Trend (7-day) │ │ [████████▓▓░░] 61.2% ↓ Target: 65% │ │ ACTION REQUIRED: Review water heater pricing │ │ │ │ Revenue per Tech Hour │ │ Current: $198 [████████░░] Target: $210 │ │ Projected Today: $201 │ │ │ │ Cash Position │ │ Outstanding: $47,200 (18 days avg) │ │ ⚠️ Commercial: $31,000 (26 days) │ │ → DECISION: Pause commercial work │ └─────────────────────────────────────────────────┘
Operations Dashboard (Hourly View)
┌─────────────────────────────────────────────────┐ │ DISPATCH COMMAND Time: 2:30 PM │ ├─────────────────────────────────────────────────┤ │ Schedule Efficiency │ │ Morning: 71% ⚠️ | Afternoon: 82% ✓ │ │ │ │ Current Gaps (Next 2 Hours) │ │ • Tech #4: 3:30-5:00 (1.5 hrs) │ │ • Tech #7: 4:00-5:30 (1.5 hrs) │ │ ACTION: 3 calls in queue, assign now │ │ │ │ Response Times (Last 4 Hours) │ │ Emergency: 72 min ✓ │ │ Priority: 3.2 hrs ⚠️ │ │ → ALERT: Re-route Tech #2 to priority │ └─────────────────────────────────────────────────┘
Technician Mobile View
┌─────────────────────────────────────────────────┐ │ YOUR PERFORMANCE Tech: Mike T. │ ├─────────────────────────────────────────────────┤ │ Today's Stats │ │ Revenue/Visit: $487 [Rank: 3 of 12] │ │ Diagnosis Accuracy: 91% ✓ │ │ Customer Updates: 100% ✓ │ │ │ │ This Week │ │ Total Revenue: $8,940 │ │ Team Average: $7,200 │ │ Your Trend: ↑ 12% │ │ │ │ Improvement Zone │ │ Material Waste: 18% ⚠️ │ │ Tip: Photo parts before pulling │ └─────────────────────────────────────────────────┘
The Decision Rules That Actually Change Behavior
Metrics without decision triggers are just scorecards. The magic happens when specific numbers trigger specific actions automatically, removing the "what should we do about this?" delay that kills most KPI systems.
Hiring Triggers
-
Revenue per tech hour exceeds $235 for 5 consecutive days → Post job listings
-
Schedule efficiency drops below 70% with full booking → Add technician
-
Customer wait times exceed 48 hours → Hire or add coverage zone
Routing Changes
-
Drive time exceeds 25% of day → Reassign territories that afternoon
-
Parts runs exceed 2 before noon → Route includes supply house stop
-
Callback required within 48 hours → Senior tech takes lead
Pricing Adjustments
-
Service line margin below 50% → 10% price increase next Monday
-
Competitor charging 30% more → Test higher price in one zone
-
Zero customer resistance for 30 days → Across-the-board 5% increase
Training Interventions
-
Diagnostic accuracy below 75% → Shadow program starts tomorrow
-
Revenue per visit bottom quartile → Sales training that week
-
Communication score below standard → Morning refresher required
The key is removing discussion time. When Tech #3's diagnostic accuracy hits 74%, he's automatically scheduled with a senior tech the next day. No meetings, no "performance improvement plans"—just immediate action based on clear metrics.
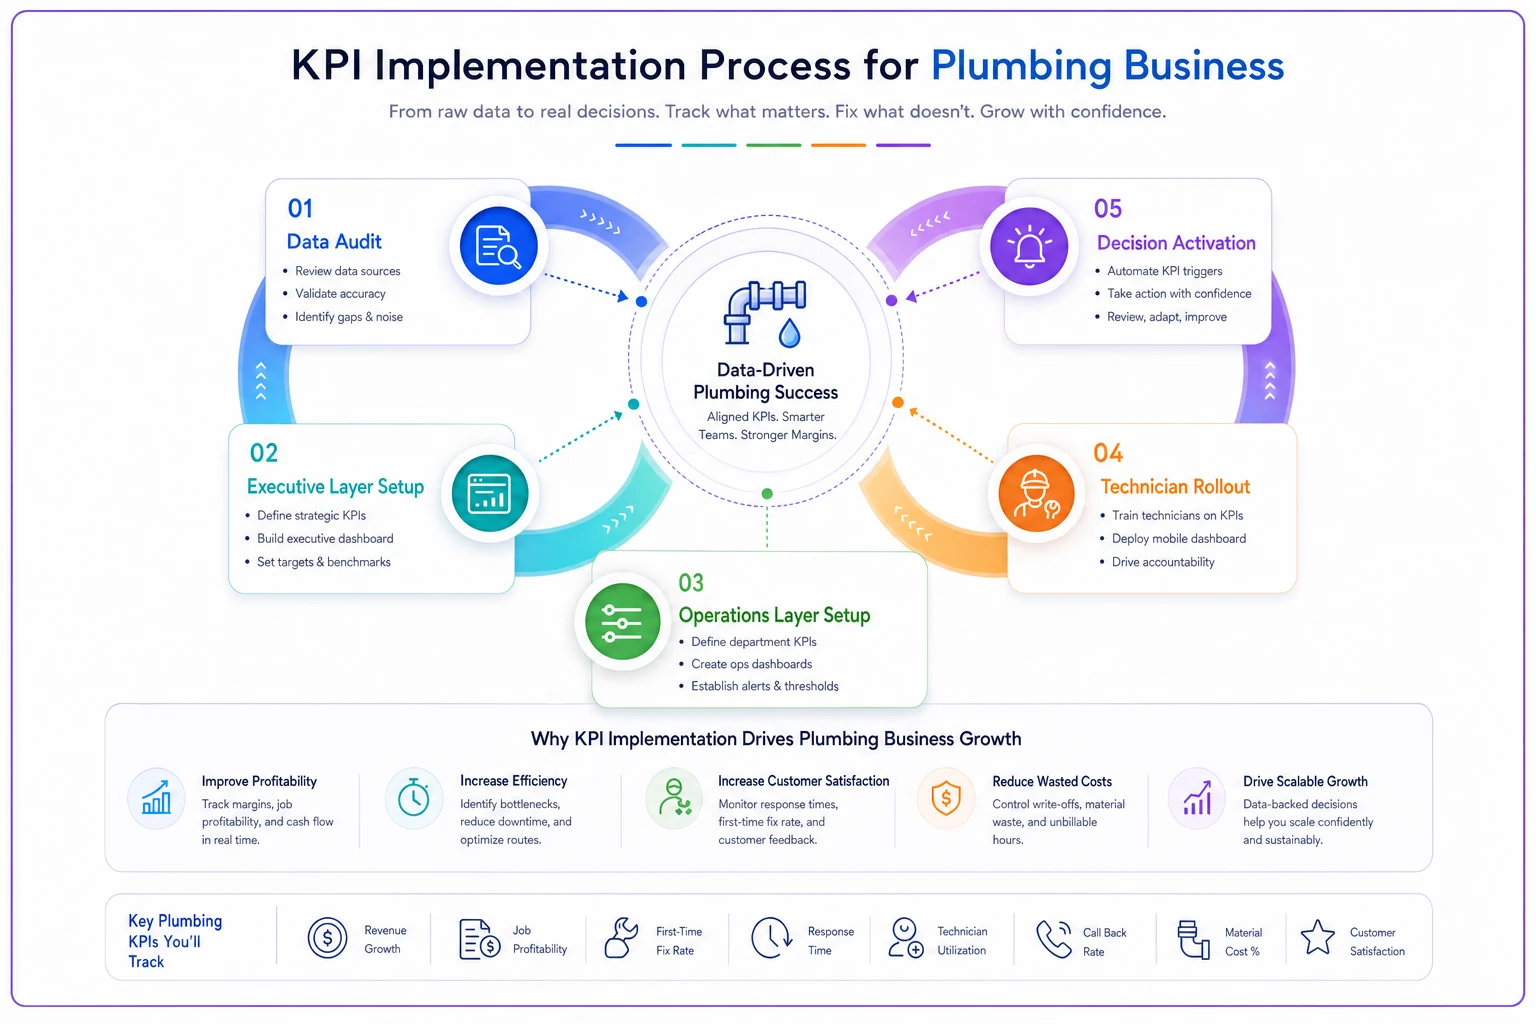
KPI Implementation Process
Rolling out a three-tier KPI system in an operating plumbing business is like changing tires on a moving truck. You need a staged approach that doesn't break current operations.
Start by validating your current data quality. Run reports on last month's jobs. Can you accurately identify service types? Do time stamps match reality? Are material costs captured? Fix the data input before building dashboards. This usually means standardizing job codes, requiring photo uploads of work, and GPS-enabling your vehicles.
A simple visual of the rollout helps teams understand the staged approach.
| Phase | Duration | Focus | Key Actions |
|---|---|---|---|
| Data Audit | 1-2 weeks | Fix inputs before outputs | Standardize job codes, validate timestamps, GPS-enable vehicles |
| Executive Layer | 1-2 weeks | Owner/GM metrics only | Implement margin tracking and revenue per tech hour |
| Operations Layer | 1-2 weeks | Add dispatch metrics | Schedule efficiency and response time tracking |
| Technician Rollout | 1-2 weeks | Field metrics introduction | Start with "information only" approach |
| Decision Activation | 2-4 weeks | Turn on automatic triggers | Begin with non-threatening routing changes |
Start by validating your current data quality. Run reports on last month's jobs. Can you accurately identify service types? Do time stamps match reality? Are material costs captured? Fix the data input before building dashboards. This usually means standardizing job codes, requiring photo uploads of work, and GPS-enabling your vehicles.
Build and test only the executive layer first. Focus on margin by service line and revenue per tech hour. These two metrics alone will reveal problems you didn't know existed. Run them in parallel with existing systems without making decisions yet.
Add the operations layer, starting with schedule efficiency. Your dispatcher needs a week to understand how their daily scramble affects company-wide metrics. Don't add all operations metrics at once—schedule efficiency and response times are enough to start.
Introduce technician metrics as "information only" first. Let them see their numbers without tying them to compensation or consequences. Most techs actually want to improve once they see where they stand.
Only after clean data flows do you activate automatic decision triggers. Start with the least threatening ones—routing changes and training assignments. Save pricing and hiring triggers for after the first full month of clean data.
Common Pitfalls When Measuring Plumbing Operations
The "Perfect Data" Trap - Waiting for perfect data means never starting. Your data will improve over time. Start with 70% accuracy and improve as you go. An imperfect dashboard driving decisions beats a perfect spreadsheet nobody uses.
Metric Overload - Some shops track 47 different KPIs. Their managers spend three hours daily updating dashboards instead of managing operations. Start with 3-4 metrics per tier. Add others only when those are automated and stable.
Gaming Prevention - Techs will game any metric you create. Track complementary metrics that prevent gaming. High jobs-per-day needs callback rate tracked. High revenue-per-visit needs customer satisfaction tracked. Material waste needs job quality tracked.
Seasonal Ignorance - Plumbing has dramatic seasonal swings. Your December water heater replacement metrics won't match July's AC drain clearing rush. Build seasonality into your targets or use rolling averages that compare to the same period last year.
When Automated Tracking Becomes Essential
Manual data entry kills KPI systems. When your dispatcher is typing timestamps while answering phones, accuracy drops to nothing. When techs self-report materials used, waste metrics become fiction. When office staff manually calculate margins, they're always three weeks behind.
Modern operational software changes this equation completely. These platforms pull GPS data directly from vehicles, match it to scheduled appointments, and calculate actual vs planned timing automatically. They track materials by linking to your supplier accounts, showing real costs, not estimates. Communication logs happen automatically when techs send updates through mobile apps.
The transformation happens when your team stops collecting data and starts responding to it. Your dispatcher sees schedule gaps forming in real-time and fills them. Your techs see their performance relative to peers and self-correct. You see margin trends early enough to adjust pricing before losses mount.
But the software needs to be built for plumbing operations, not generic field service. Plumbing has unique challenges—emergency tiers, complex diagnostics, highly variable job durations, and extreme seasonal patterns. Generic platforms force you to compromise your metrics to fit their framework.
AI-powered operational software specifically designed for plumbing businesses automates the data collection that makes these KPI frameworks actually work. Instead of manual entry and guesswork, you get real-time tracking across all three layers, automatic decision triggers, and dashboards that update themselves based on actual field operations.
The software handles the complexity of plumbing workflows while feeding clean data to your decision-making process. This isn't about replacing human judgment—it's about giving your team the accurate, timely information they need to
The software handles the complexity of plumbing workflows while feeding clean data to your decision-making process. This isn't about replacing human judgment—it's about giving your team the accurate, timely information they need to
Ready to optimize your plumbing operations?
Join 500+ plumbing businesses using Plummerly to save time, reduce scheduling errors, and improve customer satisfaction.