



Most plumbing owners treat trucks like a sunk cost. You buy them, drive them, fix them when they break, and eventually replace them when they finally give up mid-job. That reactive approach works fine when you've got one or two vans. It quietly starts costing you thousands a year once you hit four, five, six trucks — and by then the damage is baked into your P&L in ways that are hard to trace back to the fleet.
Your fleet isn't just rolling toolboxes. It's one of the three biggest capital investments in the business, behind payroll and sometimes your building lease. And unlike payroll, it's an asset that silently loses value, eats fuel, and generates maintenance bills that nobody's actually tracking against each individual truck. When you don't have a system connecting telematics data, maintenance cadence, and replacement math, you end up making five-figure decisions on gut feel.
This is a systems article, not a tips list. The goal is to show how fleet data, preventive maintenance, utilization, and replacement timing all feed into each other — and what breaks when one piece is missing.
Why Fleet Costs Hide So Well in a Plumbing P&L
The structural problem is that fleet expenses get scattered across a dozen accounting categories. Fuel is one line. Repairs are another. Insurance, registration, tires, that transmission rebuild in March — all separate. Nobody sits down and asks "what did Truck 3 actually cost us this year?" So the trucks that are quietly killing you look identical, on paper, to the ones that are fine.
In real operations, this usually shows up as a gut feeling that "we're spending too much on the vans" without any way to pin it down. The owner knows repair bills feel high. They just can't tell if it's one problem truck or the whole fleet aging at once.
What tends to happen across small fleets is that one or two vehicles generate the majority of repair spend, but because costs aren't tracked per-asset, those money pits keep getting repaired instead of replaced. A 2014 van with 190k miles gets a $2,800 repair approved because "we just put new brakes on it last quarter" — which is exactly the sunk-cost trap that keeps bad trucks on the road.
The fix starts with a simple discipline: every dollar a vehicle consumes gets tagged to that vehicle. Fuel, maintenance, insurance, depreciation, downtime. Once you can see per-truck cost, the replacement decisions almost make themselves.
Telematics: What Actually Earns Its Monthly Fee
Telematics gets sold as a GPS dot on a map. For a plumbing fleet, the dot is the least valuable part. The real value is in the data streams most owners never look at.
Stop missing service calls and double bookings.
Plummerly helps you schedule, assign, and manage every plumbing job efficiently.
- Centralized job scheduling
- Technician dispatch & tracking
- Customer notifications
No credit card required
-
Engine fault codes in real time — You get the check-engine data before the tech does. A P0401 (EGR flow) caught early is a $300 fix; ignored for two months it's a $1,400 job plus a dead truck mid-route.
-
Idle time tracking — Plumbers idle constantly
diagnostics, writing up quotes, running equipment off the engine. At $6 diesel, an hour of daily idle across five trucks is real fuel money leaking out every week.
-
Hard-braking and speeding flags — These aren't just safety metrics. They predict brake and tire wear, and they're what your insurance underwriter wants to see when renewal comes around.
-
Odometer and engine-hour auto-logging — This feeds your maintenance cadence. Manual mileage logging always drifts; telematics keeps it honest so service intervals actually trigger on time.
-
After-hours movement — Catches unauthorized use, which matters more than people admit when a van is sitting at a tech's house overnight.
The mistake owners make is buying telematics for fleet tracking and then never connecting it to maintenance scheduling or cost tracking. The GPS tells you where the truck is. The fault codes and engine hours tell you when it's about to cost you money — and that's the data that should be driving your service calendar.
Building a Preventive Maintenance Cadence That Holds Up
Preventive maintenance isn't complicated. The problem is it's always the first thing to slip when you're busy — which is exactly when your trucks are working hardest and most likely to break.
The core idea behind a telematics-driven preventive maintenance setup is simple: let the vehicle's actual usage data trigger service, not a vague "every few months" memory. A van doing 1,800 miles a month and one doing 400 miles a month should not be on the same oil-change schedule, but on most small fleets they are, because nobody's tracking per-truck mileage closely enough to differentiate.
A practical cadence for a typical plumbing service van — adjust for your actual duty cycle:
| Service Item | Interval | Why It Matters for Plumbing Vans |
|---|---|---|
| Oil & filter | 5,000–7,500 mi | Short-trip, stop-start driving wears oil faster than highway miles |
| Tire rotation | 6,000–8,000 mi | Loaded vans (parts, water, equipment) chew front tires |
| Brake inspection | Every oil change | Heavy loads + residential stop-and-go = fast pad wear |
| Transmission service | 30,000–45,000 mi | Towing jetters/trailers accelerates fluid breakdown |
| Serpentine belt | 60,000–90,000 mi | Belt failure = roadside breakdown mid-route |
| Full DOT-style inspection | Annual | Catches the slow problems before they become emergencies |
The cadence is only half of it. The other half is who owns the schedule and how it triggers. On a one-truck shop, the owner just remembers. By four or five trucks, "remembering" is where the system fails. Someone has to own a maintenance calendar that pulls live mileage and flags what's due this week, every week.
This is where a workflow platform earns its keep — not as a flashy feature, but as the thing that watches odometer data and surfaces "Truck 3 is 400 miles past its oil change" before the engine makes that decision for you. The same way a good parts par-level system keeps you from running out of common fittings mid-job, a maintenance system keeps a missed service from turning into a tow bill and a cancelled afternoon of appointments.
The Real Cost of Downtime (And Why It Changes the Math)
When a truck goes down, owners think about the repair bill. They almost never think about the second, bigger number: the revenue that truck would've produced that day.
A single service van running a normal residential day generates somewhere in the range of $1,200–$2,000 in billed work, depending on your ticket average and job mix. When that truck is in the shop for a day and a half, you're not just paying $1,100 for the repair — you're losing $2,000–$3,000 in work you either rescheduled (and some of those customers called someone else) or jammed onto another already-full truck.
This is why reactive maintenance is so expensive even when the repair bills look reasonable. A planned oil change happens on a slow Tuesday afternoon. A thrown rod happens on a Friday with eight appointments booked. The repair cost might be similar; the total cost is not even close.
The pattern across small fleets is that downtime cost usually runs 1.5x to 2x the repair cost for emergency breakdowns. Once you factor that in, spending $180 on a preventive service that prevents a $1,100 roadside failure isn't a cost — it's one of the highest-ROI things you'll do all month.
Utilization KPIs: The Metrics That Expose a Bloated Fleet
Do you actually need all the trucks you own?
Fleets grow by accretion. You add a van when you hire. You keep the old one "as a backup." Three years later you've got seven trucks and six techs, and that seventh van sits in the yard depreciating and insuring itself while producing zero revenue.
-
Revenue per truck per day — Billed work divided by truck-days worked. This is your single best indicator of whether a truck is earning its keep.
-
Utilization rate — Days the truck was actually dispatched vs. available days. Under 70% and you should ask why it exists.
-
Cost per mile — Total annual cost (all-in) divided by miles driven. This climbs sharply as a truck ages and tells you when ownership is tipping toward uneconomical.
-
Downtime days per truck — The best early-warning signal for a replacement candidate. A truck losing more than 8–10 days a year to repairs is screaming at you.
-
Maintenance cost as % of residual value — When annual repair spend starts approaching what the truck is actually worth, you're financing the junkyard.
These aren't metrics you check once. They belong on a dashboard you glance at monthly, right alongside your operational numbers. If you want a broader framework for what to actually put in front of yourself versus your techs, the breakdown in Plumbing KPIs That Drive Decisions pairs well with fleet metrics — fleet cost per truck is an executive-level number, not something your dispatcher needs to see daily.
Replacement Decision Rules: When to Stop Repairing
This is where most owners freeze. The truck still runs. You just put money into it. Replacing it means a down payment, a new loan, lettering, shelving, outfitting — easily $15k–$25k to get a new service van road-ready. So the "cheaper" move always feels like fixing what you have.
That instinct is wrong more often than it's right. The decision rule that cuts through the emotion:
Replace the truck when any two of these are true:
-
Annual maintenance cost exceeds 50% of the truck's current market value
-
The truck has lost more than 10 working days in the last 12 months
-
Cost per mile is more than 30% above your newest comparable van
-
A single repair quote exceeds 40% of replacement value
-
It's past 180,000–200,000 miles on hard residential duty
The "any two" rule matters. One expensive repair alone doesn't justify replacement. But an expensive repair on a truck that's also down a lot and costing more per mile — that's a clear signal, and the math almost always favors the new van once you add downtime cost back in.
When keeping the old truck actually makes sense
-
It's a genuine backup that covers breakdowns and peak days, and you've done the math showing a spare is cheaper than renting
-
You're in a cash crunch and a new loan payment would hurt more than occasional repairs
-
The truck does light duty — a low-mileage van doing short local runs can soldier on well past the mileage thresholds
The calculation changes depending on the role the truck actually plays. A $600/month loan on a backup van that sits four days a week doesn't pencil. A $600/month loan on a primary van that's out every day usually does.
Who should not be running this analysis monthly
If you've got one or two trucks, you don't need a formal replacement model. You need a maintenance calendar and a cash reserve. The per-truck cost tracking and utilization KPIs start paying off around the four-truck mark, when you genuinely can't hold all the numbers in your head anymore.
A Worked TCO Example
Total cost of ownership is the number that should drive every fleet decision, and it's the one almost nobody calculates. Here's what it looks like for a single van over a year of hard plumbing service.
Truck 4 — 2018 van, ~165,000 miles:
-
Depreciation (estimated loss in value this year)
~$3,500
-
Fuel (around 18,000 mi at current diesel)
~$4,800
-
Insurance (allocated share)
~$1,900
-
Maintenance & repairs
~$4,200
-
Registration, tolls, misc
~$600
-
Downtime cost (6 days lost × ~$1,500/day)
~$9,000
All-in annual cost: roughly $24,000
Now compare that to a newer van where maintenance drops to around $900, downtime falls to maybe one day, but depreciation and a loan payment are higher. When you run both all the way through — including that $9,000 downtime hit on the old truck — the newer van often lands within a few thousand dollars of the old one and removes the breakdown risk from your schedule.
The downtime line is the one owners consistently leave out, and it's usually the biggest number on the sheet. Leave it out and every old truck looks cheap to keep. That's the insight the repair-bill-only view completely misses.
How the Pieces Connect Into One System
[Telematics: Live Mileage + Fault Codes] ↓ [Preventive Maintenance Triggered on Time] ↓ [Fewer Breakdowns → Lower Downtime] ↓ [Utilization + Revenue Per Truck Stay Healthy] ↓ [Per-Truck TCO Stays Accurate] ↓ [Clean, Data-Driven Replacement Decisions]
Here's a simple visual of the workflow that ties the pieces together.
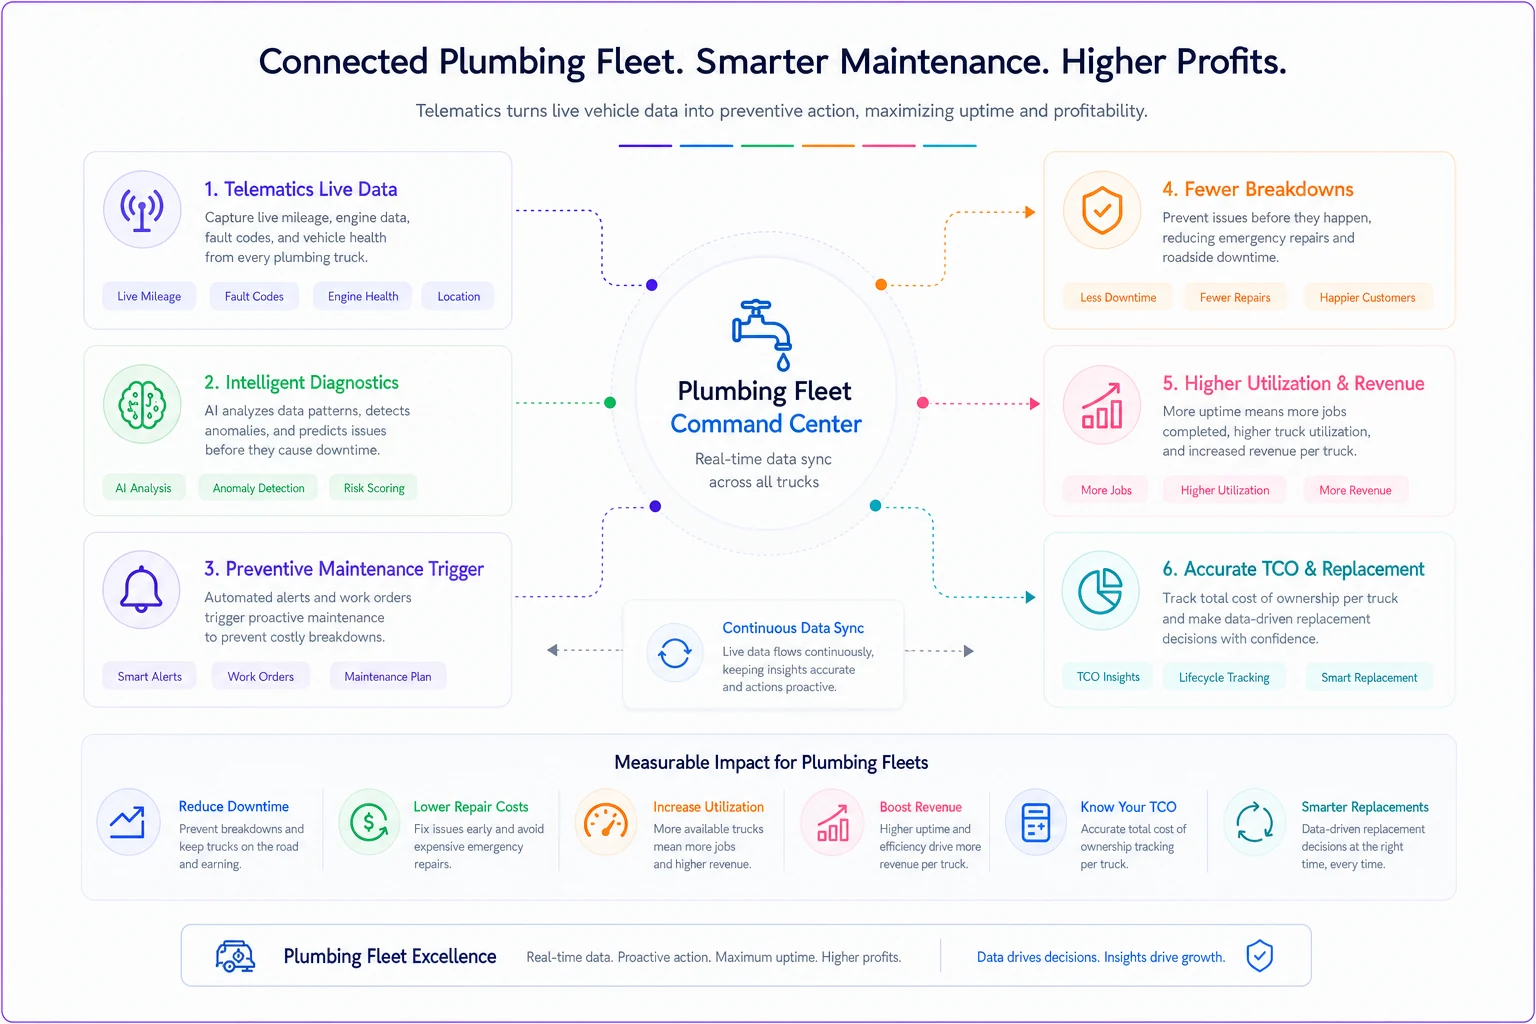
Individually, none of this is complicated. The value is in how the pieces connect. Break any link and the chain fails. No telematics means your maintenance schedule drifts and services get missed. No per-truck cost tracking means you can't spot the money-pit van. No downtime accounting means your replacement math is wrong in the direction that keeps bad trucks on the road.
On a one-truck operation you can run the whole chain in your head. The reason small fleets struggle isn't that fleet management is hard — it's that the mental version stops scaling right around the point you're too busy to keep it in your head, which is also the point where the stakes get big enough to matter. That's where a workflow platform that ties mileage, service history, and per-truck cost into one place stops being a nice-to-have and starts being the thing that keeps a five-figure mistake from sneaking through.
A Real Scenario
A six-truck residential plumbing shop was running about $52k a year in total fleet maintenance and couldn't figure out why it kept climbing. No per-truck tracking — just one big repair line in QuickBooks.
Once they tagged every cost to a specific van, the picture was obvious: two of the six trucks were generating well over half the repair spend, and both were also losing the most days to breakdowns. One had already eaten more in repairs that year than it was worth on the open market. They'd been approving repairs on both because each individual bill seemed reasonable in isolation.
They replaced the worst offender, moved the second to backup-only light duty, and put the remaining fleet on a mileage-triggered service cadence. Over the next year, total fleet maintenance came down to roughly $34k–$38k. But the part the owner kept coming back to wasn't the dollar savings — it was that the number of mornings starting with "a truck won't start" dropped to almost none. The schedule got predictable. That predictability was worth more to the business than the raw cost reduction.
Bottom Line
Your fleet is a financial system, not a pile of trucks. When telematics, maintenance cadence, utilization tracking, and replacement rules operate as separate concerns — or worse, as things living only in your head — costs hide and bad decisions compound.
Track cost per truck, let usage data drive your service schedule, always include downtime in your math, and set hard replacement rules before emotion gets a vote. Do that, and the five-figure fleet decisions stop being guesses and start being arithmetic.
Do that, and the five-figure fleet decisions stop being guesses and start being arithmetic.
Ready to optimize your plumbing operations?
Join 500+ plumbing businesses using Plummerly to save time, reduce scheduling errors, and improve customer satisfaction.