



Most plumbing owners I talk to can quote a job to the dollar but can't tell you whether they'll make payroll in March. That gap is the whole problem. You've got solid instincts on pricing, decent job costing, and a QuickBooks file — but none of it connects into something that answers the real questions: Can I afford another truck? Should I hire now or wait? Why is cash tight in a month where revenue looked fine?
This is about the finance machinery underneath a plumbing shop. Not accounting for the sake of accounting — the actual operating system. How your chart of accounts feeds your forecast, how your forecast catches seasonality before it wrecks your bank balance, and how both of those feed the two scariest decisions a 1–10 truck shop makes: when to hire and when to invest.
Why your financials don't tell you anything useful
The pattern that shows up in shops under ten trucks is almost always the same. The books are technically fine — reconciled, clean, tax-ready — but they're organized for the accountant, not the operator. Revenue lands in one big "Service Income" bucket. Payroll is one line. Materials is one line. Everything rolls up into a P&L that tells you the shop made money last year, and almost nothing about why or where.
The issue is structural. A chart of accounts built for tax filing collapses exactly the detail you need for decisions. When drain cleaning, water heater installs, repipes, and service calls all flow into the same income line, you can't see that your repipe work is subsidizing a service division that's actually losing money on every truck roll. You feel it — the stress, the tight weeks — but you can't point at it.
The core idea: your chart of accounts should mirror how you actually run jobs, not how you file taxes. Taxes are a once-a-year output. Operating decisions happen weekly.
Mapping accounts to job types
The first fix is boring and high-leverage: split income and direct costs by job type. For a typical residential-and-light-commercial shop, that looks something like this:
| Job Type | Income Account | Direct Labor | Direct Materials | Target Gross Margin |
|---|---|---|---|---|
| Service / Diagnostic | 4000 | 5000 | 5100 | 55–65% |
| Drain & Sewer | 4010 | 5010 | 5110 | 50–60% |
| Water Heater Install | 4020 | 5020 | 5120 | 40–50% |
| Repipe / Remodel | 4030 | 5030 | 5130 | 35–45% |
| Maintenance Plans | 4040 | 5040 | 5140 | 60–70% |
The gross margin targets matter more than the exact account numbers. Once your books are structured this way, your monthly P&L stops being a report and starts being a diagnostic. You can see that water heater installs look like big revenue but carry thin margins after the tank cost, while your maintenance plan work quietly throws off the best margin in the shop.
This structure is also what makes real per-technician P&L possible later — you can't allocate what you never separated. And if your field software and accounting system aren't passing job-type data cleanly between each other, this whole thing falls apart, which is why the integration layer between your tools matters so much.
The monthly forecasting cadence
A chart of accounts tells you what happened. A forecast tells you what's coming. The shops that run out of cash almost never run out because they weren't profitable — they run out because profit and cash don't arrive on the same schedule.
Stop missing service calls and double bookings.
Plummerly helps you schedule, assign, and manage every plumbing job efficiently.
- Centralized job scheduling
- Technician dispatch & tracking
- Customer notifications
No credit card required
Plumbing business cashflow forecasting isn't a once-a-year budgeting exercise. It's a rolling monthly rhythm. The cadence that actually works for small shops:
-
First business day of the month — close the prior month. Pull actuals into the forecast model and compare against what you predicted.
-
Update the 13-week cash view. This is the one that keeps you solvent. Not the annual budget — the next 13 weeks of money in and money out, week by week.
-
Re-forecast the next 90 days of revenue by job type, using your booking pipeline and seasonal pattern, not last month flat-lined forward.
-
Flag variances over 10%. If service revenue came in 15% under forecast, you want to know that week, not when the account overdrafts.
-
Adjust labor and parts spend based on what the 13-week view shows.
The 13-week cash flow view is the single most important document in a small plumbing shop, and most owners have never built one. It's not a P&L. It tracks actual cash — when invoices will realistically collect (not when they're issued), when payroll hits, when your insurance renewal and quarterly taxes land. A shop can show a $40k profit for the quarter and still miss payroll in week 6 because a big repipe's receivable hasn't landed and the tank supplier wants paying now.
Here's a simple visual workflow of the monthly forecasting cadence and the 13-week cash view.
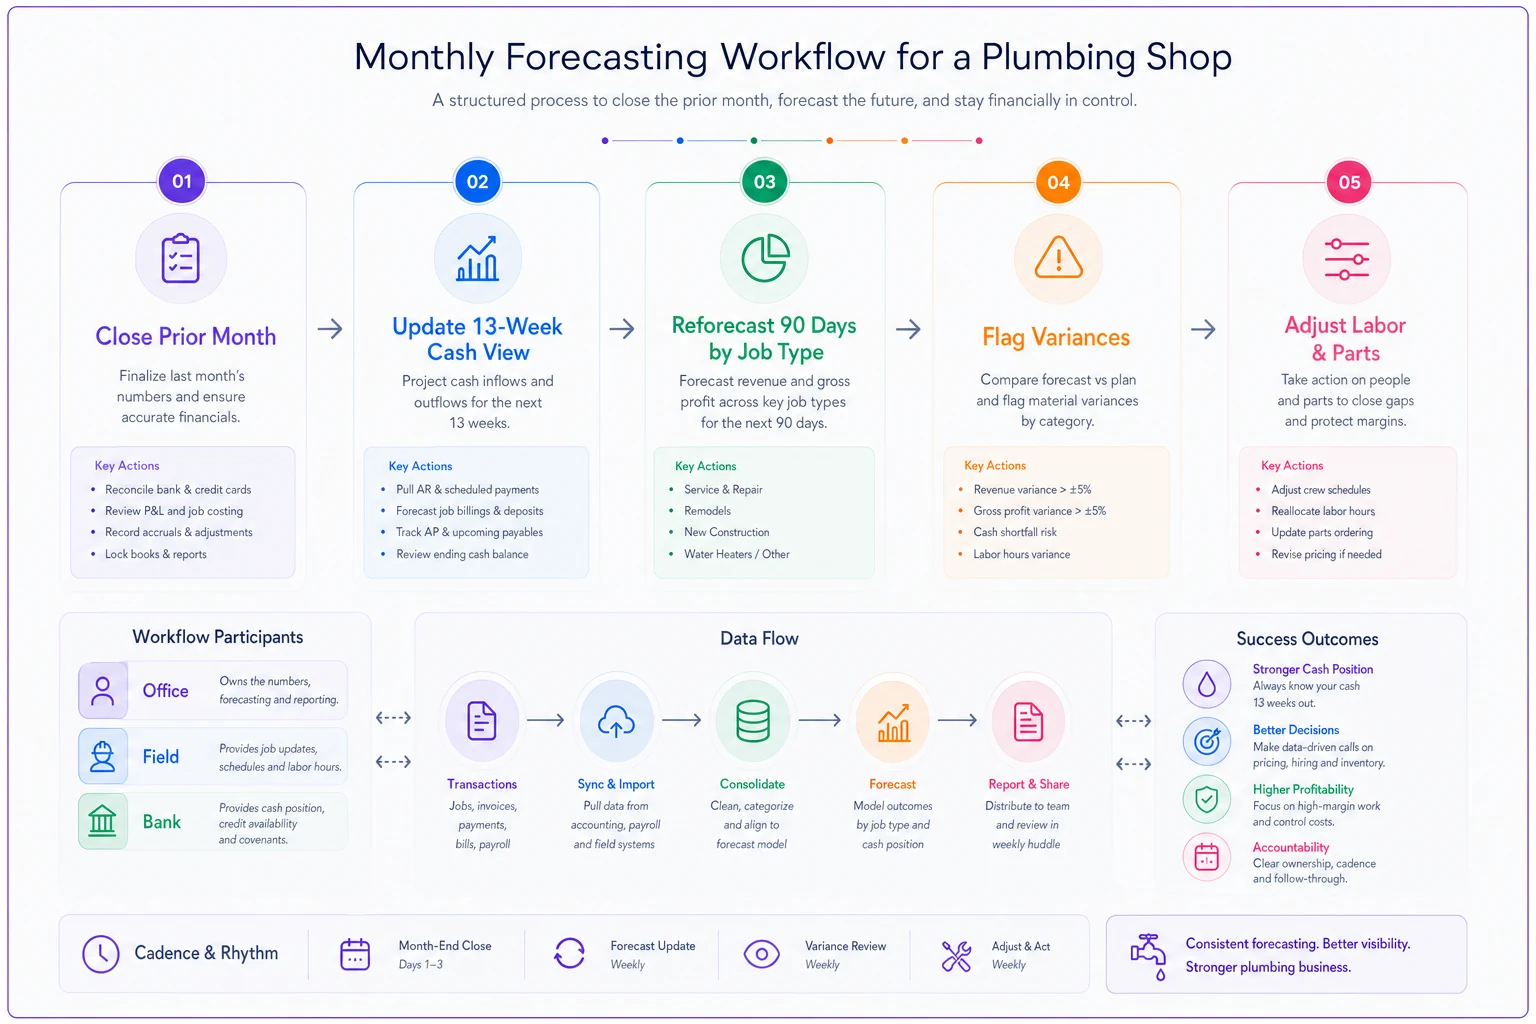
The 13-week cash view keeps you honest about timing — not just profitability.
A typical variance that breaks the month
Here's how it usually goes wrong. A shop forecasts around $120k in revenue for the month and spends like that's locked in. But 30% of that revenue was repipe and remodel work that invoices on completion — and two of those jobs slip two weeks because of a tile guy, an inspection delay, whatever. On paper it's still a $120k month. In the bank, close to $35k of it hasn't arrived, and payroll plus supplier payments don't care. That's a cash crunch inside a good month.
The fix isn't working harder. It's forecasting cash and profit as two separate things, and watching the gap between them.
Working-capital rules that keep you out of trouble
Once you're forecasting cash weekly, you need a few hard rules about how much buffer to hold. These aren't suggestions — they're the thresholds that separate shops that sleep at night from shops that live on their credit line.
-
Cash reserve floor
6–8 weeks of fixed operating costs.
Fixed meaning payroll, vehicle payments, insurance, rent, software — the stuff that doesn't drop when the phone goes quiet. -
A/R ceiling
no more than 20% of trailing-90-day revenue sitting uncollected.
Cross that and collections becomes a dedicated weekly job, not an afterthought. -
Parts inventory
cap at what two to three weeks of normal volume consumes.
Cash tied up in a stockroom of fittings is cash you can't use to make payroll. -
Credit line usage under 30% in normal months. The line is for genuine emergencies and seasonal dips, not for covering a structural cash leak.
The A/R rule is where small shops bleed quietly. Thirty days of float on a repipe-heavy month can swing your cash position by tens of thousands. Tightening the field-to-office invoicing loop so jobs bill same-day instead of three days later isn't a paperwork improvement — it's a working-capital improvement. Every day you shave off collection time is a day of cash you get back.
Seasonality scenario templates
Plumbing demand isn't flat, and pretending it is in your forecast is how January catches you. Most shops have a predictable shape: a winter spike (frozen lines, heating-related calls), a spring surge (remodels, inspections), a mid-summer softening in some markets, and a slow stretch somewhere in late winter or early fall depending on region.
| Scenario | Revenue Assumption | Labor Response | Cash Buffer Target |
|---|---|---|---|
| Base | Trailing 12-mo seasonal pattern | Current crew, normal OT | 6 weeks fixed costs |
| Slow | 20% below base for the quarter | Freeze hiring, cut OT, push maintenance plans | 8 weeks fixed costs |
| Surge | 25% above base | Approved OT, subcontractor overflow | 6 weeks + parts float |
Running all three isn't about prediction — it's about preparation. When you've already decided what you'll do if revenue drops 20%, you act in week one instead of panicking in week five. The shops that handle slow seasons well aren't luckier. They pre-decided their moves.
Per-technician P&L: the number that changes everything
Shop-level profit hides too much. The moment you grow past two or three trucks, you need to know what each technician actually contributes — not their revenue, their profit.
-
Revenue generated (billable work, by job type)
-
Minus their fully-loaded labor cost (wage + payroll taxes + benefits + their share of vehicle and insurance)
-
Minus direct materials on their jobs
-
Minus an allocation of overhead (dispatch, admin, software, rent — split per truck)
What falls out is each tech's real contribution. And the spread between techs is almost always bigger than owners expect. One tech running efficient diagnostics with a high first-time-fix rate might contribute $9k–$11k in monthly profit. Another with the same wage, more callbacks, and slower jobs might contribute half that — or less once you count the return trips.
This is where your job-type chart of accounts pays off, because clean job costing data is what makes per-tech allocation trustworthy instead of a guess. Without it you're assigning blame on vibes.
The insight most owners miss: the problem is rarely the tech. It's usually the mix of work they're assigned. A strong technician buried in low-margin service calls will show weak numbers that have nothing to do with skill. Per-tech P&L tells you where to look — it doesn't tell you who to fire.
The hire vs. invest decision
Every growing shop hits the same fork: demand is outpacing capacity, and you have cash or credit to deploy. Do you hire another technician, or put money into something — software, trucks, equipment, marketing — that makes your existing crew more productive?
Most owners decide this emotionally. The phone's ringing off the hook, so they hire. Six months later they've got a truck that's half-utilized and a new fixed cost they can't easily unwind.
Decision triggers, not gut feel
Hire another technician when:
-
Your existing crew is consistently billing over 85% capacity for 8+ weeks
-
You're turning away or long-scheduling enough work to fill most of a new truck's calendar
-
Your cash reserve can cover 3–4 months of a new tech's fully-loaded cost before they're profitable
-
Your per-tech P&L shows current techs are solidly profitable (you're scaling something that works, not duplicating a leak)
Invest in productivity instead when:
-
Techs are busy but a chunk of their day is drive time, parts runs, or admin
-
Your first-time-fix rate is dragging and return trips are eating capacity you already pay for
-
A tool or process change would recover meaningful billable hours from the crew you already have
The math is usually clearer than owners expect. A new technician runs roughly $70k–$95k in fully-loaded annual cost, and they're often not truly profitable for three to six months. If instead you could recover even an hour of billable time per tech per day across four techs by cutting parts runs and tightening routing, that's capacity worth tens of thousands a year — with no new fixed payroll, and you can turn it on in weeks, not quarters.
When hiring actually makes sense: you've maxed real productivity, the demand is durable (not a one-month spike), and the numbers show your existing model is profitable per truck. Duplicate what works — don't scale what doesn't.
When it's a bad idea: you're hiring to cover a demand bump that'll fade, your current trucks aren't individually profitable, or your cash reserve can't absorb the ramp-up months. Adding a truck to a shop with a cash-timing problem doesn't fix the problem. It makes it bigger and harder to reverse.
A real scenario
A four-truck shop doing roughly $1.4M a year kept feeling broke despite a healthy-looking P&L. The owner was convinced he needed a fifth truck to grow out of the squeeze.
When the books got restructured by job type, two things surfaced. First, his service division — about 40% of revenue — was running close to breakeven after return trips and drive time, dragging down margins that his repipe work was quietly covering. Second, his 13-week cash view showed the real issue: repipe receivables were landing 25–35 days out while payroll and tank suppliers needed paying weekly. He didn't have a profit problem. He had a timing problem wearing a profit problem's clothes.
Instead of hiring, he did three things: tightened invoicing so service work billed same-day, moved repipe jobs to progress billing instead of bill-on-completion, and reassigned job mix so his strongest tech wasn't stuck on low-margin service calls. Within a couple months the cash crunch eased noticeably — not because revenue jumped, but because the same revenue arrived on a schedule that matched the bills. The fifth truck conversation got postponed, which was the right call.
Where software fits — quietly
None of this requires fancy tooling to understand, but it's painful to run by hand. The forecasting cadence, the 13-week cash view, the per-tech allocation — doing all of that in spreadsheets means it happens late, if at all, because it's tedious and it's always the thing that slips when you're busy.
This is where operational software earns its place. When your field platform and accounting system share job-type data cleanly, your per-tech P&L and job-costed forecast can update without waiting for a month-end scramble. AI-assisted operational tools can watch your variances and flag a 10% miss in week one, pull your pipeline into the revenue forecast automatically, and surface a cash gap before it becomes a payroll problem — so you're reacting to a signal instead of discovering a crisis. The value isn't the automation for its own sake. It's that the system does the boring, constant updating that owners reliably skip when things get busy, which means your numbers are actually current when you need to make a call.
The goal is a finance system that's always on, always current, and connected end to end — so the chart of accounts, the forecast, and the hire-vs-invest decision all speak the same language.
Pulling it together
A plumbing shop's finances aren't four separate problems — one chart of accounts problem, one forecasting problem, one cash problem, one hiring problem. They're one system, and the leverage comes from connecting them. Structure your accounts by how you run jobs. Forecast cash and profit as separate streams on a monthly cadence. Hold working-capital buffers that match your seasonality. Measure profit per technician, not just revenue. Decide hire-vs-invest against thresholds you set before the pressure hits.
Do that, and the question "can I make payroll in March?" stops being a knot in your stomach and becomes a number you can look up — three months early, while there's still time to do something about it.
Do that, and the question "can I make payroll in March?" stops being a knot in your stomach and becomes a number you can look up — three months early, while there's still time to do something about it.
Ready to optimize your plumbing operations?
Join 500+ plumbing businesses using Plummerly to save time, reduce scheduling errors, and improve customer satisfaction.